ფაილი:Atmospheric CO2 with glaciers cycles.png

თავდაპირველი ფაილი ((939 × 680 პიქსელი, ფაილის ზომა: 41 კბ, MIME ტიპი: image/png))
| ეს ფაილი მდებარეობს Wikimedia Commons სერვერზე. იხილეთ მისი აღწერის გვერდი სრული ინფორმაციისთვის. |
 |
გადასვლა ფაილის გვერდზე |

|
ეს გრაფიკი უნდა იყოს გადახატული .svg ფორმატში. ყოველივე ეს გვაძლევს რამდენიმე მოგებას, რის შესახებაც შეგიძლიათ წაიკითხოთ Commons:Media for cleanup. თუ თქვენ უკვე გაქვთ .svg ვერსია, ძალიან გთხოვთ ატვირთოთ იგი. ატვირთვის შემდეგ გთხოვთ შეცვალოთ ეს თარგი შემდეგით - {{Vector version available|ფაილის სახელი.svg}}.
|
რეზიუმე
| აღწერა |
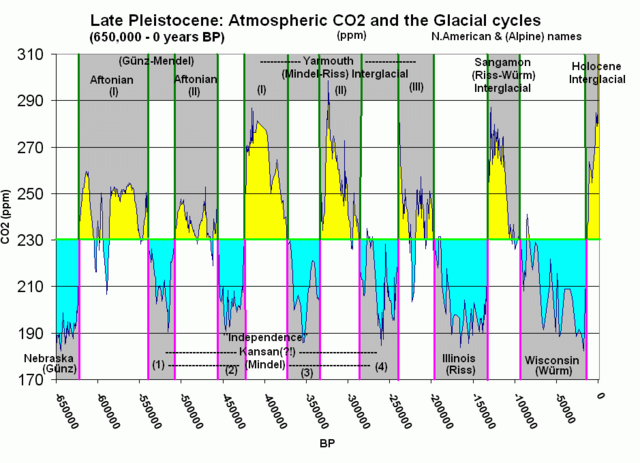
Ice Core data for Atmospheric CO2 related to the glacial cycles |
| თარიღი | |
| წყარო |
Source data: (Combined)
|
| ავტორი | Tom Ruen en:User:Tomruen |
| უფლება (ფაილის მეორეული გამოყენება) |
PD-self |
ლიცენზია
| მე, ამ ნამუშევრის საავტორო უფლების მფლობელი, გადავცემ მას საზოგადოებრივ დომენში. ეს უფლება ვრცელდება მთელი მსოფლიოს მასშტაბით. ზოგიერთ ქვეყანაში ეს შეიძლება იურიდიულად შეუძლებელი იყოს, ასეთ შემთხვევაში: მე ვაძლევ უფლებას ნებისმიერს, რათა გამოიყენონ ეს ნამუშევარი ნებისმიერი მიზნით, ყოველგვარი წინაპირობის გარეშე, გარდა კანონით გათვალისწინებული შემთხვევებისა. |
Upload foo
This image was copied from en:Image:Atmospheric_CO2_with_glaciers_cycles.gif. Below is the original description.
Original edit-history of the image
- 15:25, 3 December 2005 en:User:Tomruen m
- 15:13, 3 December 2005 en:User:Tomruen (link source of data)
- 14:38, 3 December 2005 en:User:Tomruen
ატვირთვის ჟურნალი
| თარიღი/დრო | განზომილებები | მომხმარებელი | კომენტარი |
|---|---|---|---|
| 6 მაისი 2006, 14:20:43 | 939 × 680 (49916 bytes) | Neumeier (განხილვა · წვლილი) | {{Information| |Description=Ice Core data for Atmospheric CO2 related to the glacial cycles |Source=copied from [[:en:Image:Atmospheric_CO2_with_glaciers_cycles.gif]] |Date=3 December 2005 |Author=en:User:Tomruen |Permission=PD-self |other_versions= }} ' |
ფაილის ისტორია
დააწკაპუნეთ თარიღზე/დროზე ფაილის დასათვალიერებლად, როგორც ის მაშინ გამოიყურებოდა.
| თარიღი/დრო | მინიატიურა | ზომები | მომხმარებელი | შენიშვნა | |
|---|---|---|---|---|---|
| მიმდინარე | 15:58, 18 აგვისტო 2014 | | 939×680 (41 კბ) | GifTagger | Bot: Converting file to superior PNG file. (Source: Atmospheric_CO2_with_glaciers_cycles.gif). This GIF was problematic due to non-greyscale color table. |
ბმულები
ამ ფაილზე ბმული მოცემულია შემდეგ გვერდებზე:
ფაილის გლობალური გამოყენება
ეს ფაილი გამოიყენება შემდეგ ვიკებში:
- გამოყენება als.wikipedia.org-ში
- გამოყენება de.wikipedia.org-ში
- გამოყენება de.wiktionary.org-ში
- გამოყენება en.wikipedia.org-ში
- გამოყენება en.wikibooks.org-ში
- გამოყენება es.wikipedia.org-ში
- გამოყენება fr.wikipedia.org-ში
- გამოყენება hu.wikipedia.org-ში
- გამოყენება it.wikipedia.org-ში
- გამოყენება nl.wikipedia.org-ში
- გამოყენება no.wikipedia.org-ში
- გამოყენება vi.wikipedia.org-ში
- გამოყენება zh.wikipedia.org-ში